
It is becoming more and more clear that GDP (gross domestic product) alone is not a good indicator of a country’s performance. For example, when a country’s law system is very complex and requires lots of expensive lawyers, money spent on lawyers will count towards higher GDP, even though this is clearly not a good thing for the country and its citizens.
That is why The Boston Consulting Group (BCG) developed a better way to measure “sustainable well-being” of a country, based on 44 different indicators, and GDP per capita is only one of them. The indicators measure, among others, the rate of unemployment, inflation, prevalence of diseases, life expectancy, quality and accessibility of education, quality of infrastructure, state of the environment, control of corruption, press freedom, and much more.
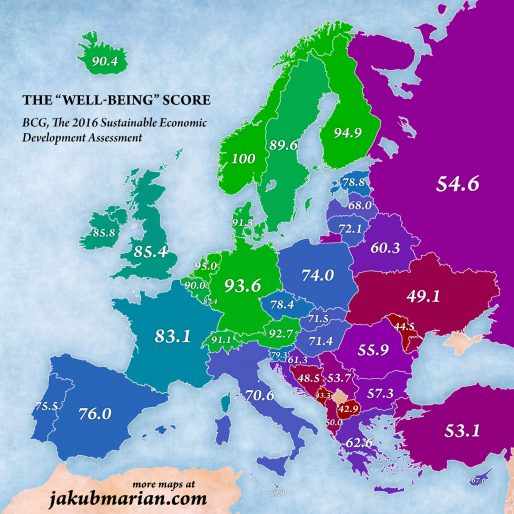
The following map is based on BCG’s 2016 report. For comparison, here are the scores of other major nations: USA 83.7, Japan 81.3, Brazil 49.3, China 46.5, India 32.6. Note that Crimea is not coloured in the map because it is not clear where it belongs, and that there are no data for Kosovo.